

The South Carolina Department of Public Health has developed an interactive Heat Related Illness Dashboard. The dashboard includes interactive data pages that allow you to view data that’s specific to each county.
Using the Filters
In the header of the dashboard there are 3 filters: Select Year, Select Month, and Select County. These filters can be used to view the time period and county of your choosing.

Click the drop-down arrow on each filter to view the options available for use on the dashboard. The select month feature is only available for the map.
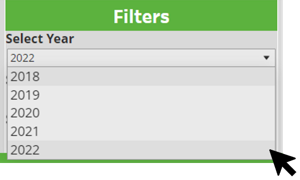
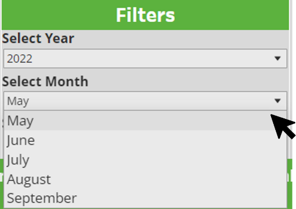
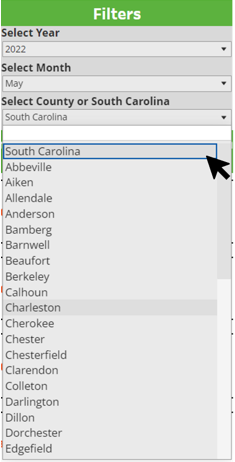
Using the Map
To view county specific data, hover your cursor over the county you want to view on the state map. A black outline will highlight the county borders and show additional information about the selected county.
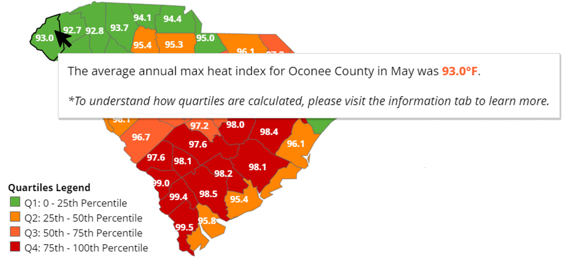
Tooltips
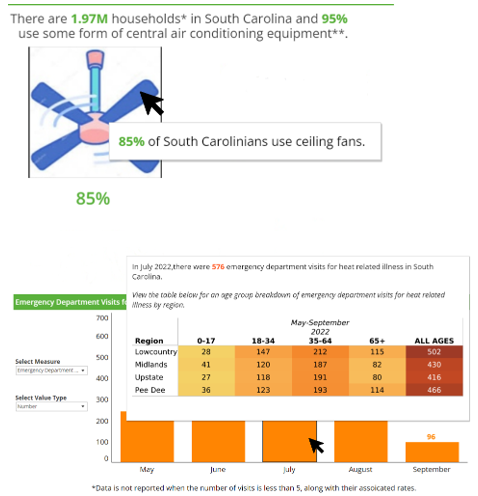
To view additional information about a graphic, hover over the graphic with your curser and additional information, if available will appear in a pop-up box.
Navigating to Additional Information
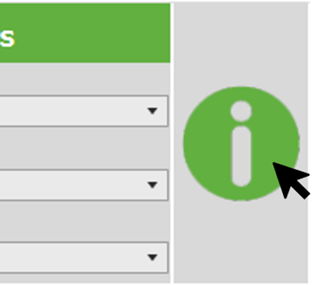
To learn more about the dashboard you can click on the “i” icon on the right of the header. This icon will direct you to the information page.
On the information page, you can select URLs that will redirect you to websites that provide more information about the topics discussed on the dashboard.

To return to the main dashboard page, you can click the arrow on the right side of the header.
